Monday, February 14, 2011

Some Less Known Tricks to easily HACK WINDOWS (Yes Viruses Does Try these too !!!! )


Cool Tricks:

Today I am going to tell you 2 almost less known and cool tricks, what can be used to break into someone’s system J   ( Happy …. Haaaaaaaaa )

All these attacks are very simple, effective and their robustness lies that they exists in the main architecture of windows.

Trick 1:

The first one is API vulnerability. This is one of the most common security mistakes Developers always made (me too L ) while coding.
The syntax of CreateProcess API is:
 BOOL WINAPI CreateProcess(
  __in_opt     LPCTSTR lpApplicationName,
  __inout_opt  LPTSTR lpCommandLine,
  __in_opt     LPSECURITY_ATTRIBUTES lpProcessAttributes,
  __in_opt     LPSECURITY_ATTRIBUTES lpThreadAttributes,
  __in         BOOL bInheritHandles,
  __in         DWORD dwCreationFlags,
  __in_opt     LPVOID lpEnvironment,
  __in_opt     LPCTSTR lpCurrentDirectory,
  __in         LPSTARTUPINFO lpStartupInfo,
  __out        LPPROCESS_INFORMATION lpProcessInformation
);


I am not going in deep and we are only interested in the first 2 parameters:
lpApplicationName and lpCommandLine.
The description of the API states as follow:
The lpApplicationName parameter can be NULL. In that case, the module name must be the first white space–delimited token in the lpCommandLine string.

So there are 2 ways to cal this API, firstly:

CreateProcess(_T("C://Windows//notepad.exe"),NULL  …… )

And the second is:

CreateProcess(NULL,_T("C://Windows//notepad.exe"), …… )

The attack lies in these parameters only.
If we are using a long file name that contains a space, use quoted strings to indicate where the file name ends and the arguments begin; otherwise, the file name remain ambiguous for this API. For example, consider the string "c:\program files\sub dir\program name". This string can be interpreted in a number of ways. The system tries to interpret the possibilities in the following order:

c:\program.exe files\sub dir\program name
c:\program files\sub.exe dir\program name
c:\program files\sub dir\program.exe name
c:\program files\sub dir\program name.exe

and thus the main point to notice here is that while resolving path in that way if we put any of the malicious/hack program with above bold mentioned names ( ex: program.exe , sub.exe etc), that program will get launched in-spite of the targeted program.

Let’s have a practical look now.
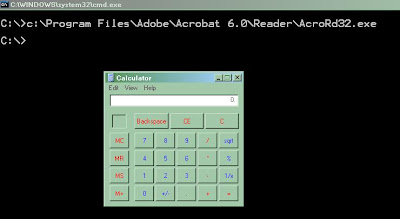
Copy “calc.exe” (calculator) or any other executable to C:\ and rename it to “Program.exe”


Now run the command prompt and type “Program files\\executbale.exe”
Like I have chosen:
C:\Program Files\Adobe\Acrobat 6.0\Reader\ AcroRd32.exe
Now type the whole path with “Quotes” and you can see Adobe reader gets launched as usual:


But then make a minor mistake (as most of the developers make while coding), only remove the quotes from this path and  J  :


BINGO!!!!  In spite of Adobe reader, Calculator gets launched.
So the only thing you have to find out, is yours victim program calling any process and if yes try this attack on his/her executableJ . If successful, you have a way to launch your program with the credential of victims’ program and suppose if his program has got ADMIN privileges thenJ.

Trick 2:

This Hack also lies in the Windows Blind trusting of its registry entries.
Most of you might know about debuggers.  A debugger or debugging tool is a computer program that is used to test and debug other programs , Microsoft provides a default debugger with Windows OS (Dr.WATSON) that gathers information about  a program/computer system when an error (or user-mode fault) occurs with a program which helps them to figure out the main cause of the bug/crash.

A user can have more than one debugger in his/her system,  In which scenario he/she has to decide that which one should be the default debugger of his/her system. I mean which debugger should invoke when any (remember ANY...) program on his/her system crashes.
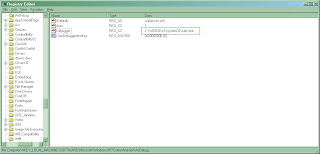
The registry entry for this lies at:

HKEY_LOCAL_MACHINE\SOFTWARE\Microsoft\Windows NT\CurrentVersion\AeDebug

You will find there a key with name:  “Debugger”
And the value would be something like: "C:\WINDOWS\system32\vsjitdebugger.exe" -p %ld -e %ld

Now the hidden truth here is that Windows never checks that any executable mentioned there is actually a debugger or not, it simply launches it (I think by this time smile starts coming to your faceJ ), so just imagine an attack scenario where you change the victim’s registry entry with your tool path, you simply WAIT for some application to crash on your victims’ system (there are many, you need not worry, after every 10-15 minutes something will keep crashing)
As soon as your victims’ system crashes, Windows will launch your tool thinking it is a debugger and you are IN J (Yes need not even learn anything, let someone else’s’ mistake makes your way to your target system).

Enough theory (I hate this portion you know…), now just have some practical look (I love thisJ)
I wrote a very simple code which crashes every time we run it:

           #include "stdafx.h"
           #include "stdio.h"
           #include "conio.h"
           char *p;

           void error()
       {
                 p = NULL;
                delete p;
       }

  int _tmain(int argc, _TCHAR* argv[])
 {
               
    p = new char(10);
    error();
    printf("%s",*p);  //Error Trying to access invalid memory
                    // address
    getche();
    return 0;
  }


Now run this code with the debugger registry's entry as:
"C:\WINDOWS\system32\vsjitdebugger.exe" -p %ld -e %ld
And yes as soon as the code crashes the VS debugger gets launched.


Now Change this registry entry with any dummy program name (in real world attack, this could be any MALICIOUS program)

Suppose I changed the entry with system calculator program path
“C:\WINDOWS\system32\calc.exe”


And run the same program again,
Now see the magic… BINGO!!!, The Calculator program gets launched, that too without coming in the knowledge of user as well as auto system provoked J




Windows'/Applications' Attack: Via WINAPI Parameters' Tampering


Today I will be writing on a very interesting topic to tell you that actually how some of the attacks on the windows work.
I already wrote over WINDOWS ARCHITECTURE where I wrote very briefly about the WINDOWS APIs.
Well first have looks what the hell these windows APIs are actually?
The Windows API, informally WinAPI, is Microsoft's core set of application programming interfaces (APIs) available in the Microsoft Windows operating systems. It was formerly called the Win32 API and used by applications to invoke windows services.

In a nutshell I can say that via these APIs, Windows provide a way to communicate to OS and let it carry/perform the task for the application.
On a broad spectrum, these Windows API functionalities can be grouped into eight categories:
Base Services
Advanced Services
Graphics Device Interface
User Interface
Common Dialog Box Library
Common Control Library
Windows Shell
Network Services
Pretty much the names are self descriptive. Okie, but then where these APIs reside in my system and how I can use them …. Hmmmmmmmm… Let’s have a look J

Got to %systemroot%\system32 and you will find many DLL’s (Dynamic Link Libraries … Thinking of writing something on these also but not now J  )
You will find bunches of Dlls there, some to name are Kernel32.dll, Win32spl.dll etc. Hover the mouse over any of them and you will find a brief description of them as of:


But then how I will know that what functionalities these Dlls are providing to me.
There are many tools for this; I will be using Dll Export View for this. Use this tool, and simply drag and drop the Dll for which you want to see exported functions. (I have done for Kernel32.dll)


So you can see all the functions being exported by this Dll. You will find 2 versions of each function, ASCII Version (CreteFileA() ) & UNICODE Version  (CreateFileW()). This is for providing backward compatibility support.
Now the main thing is that how we use these Functions in our code. The answer is there exists 2 ways,
Via Implicit Linking and Via Explicit Linking.  All the Windows Dlls are loaded using explicit linking where we do the follow:


  1.             Load the Dll    
  2.                  Get the Function pointer      
  3.              Call the function with Function pointer and passed the arguments 
  4.              Once done with work, unload the Dll.


But the good thing is that all these things are done and carried by windows internally, here we need to simply call the API function:
Like if I want to create a process, I might be using “CreateProcess ()” API in Kernel32.dll
And my code will look like:

  #include "windows.h" 
  
// bla bla bla J ….. (Other Code)
    
 STARTUPINFO siStartupInfo;
    PROCESS_INFORMATION piProcessInfo;
    memset(&siStartupInfo, 0, sizeof(siStartupInfo));
    memset(&piProcessInfo, 0, sizeof(piProcessInfo));
    siStartupInfo.cb = sizeof(siStartupInfo);
CreateProcess(_T("C://Windows//notepad.exe"),NULL,0,0,FALSE,
CREATE_DEFAULT_ERROR_MODE,0,0,&siStartupInfo, &piProcessInfo);

I have not done anything, As i mentioned above, the "windows.h"  header file will take care of all the previously mentioned steps to call the respective WINAPI.
 
Now the question arises, why I should use MS API , the reply is NO, You are not bounded in most of the cases, but these APIs are well tested and written by MS Professionals and well suited as per Windows architecture. You may write your own code but then there will be 2 fear factors:
1)      Whether it will run on all the windows or not?
2)      The code might be buggy and non –optimal.
So no one is stopping you to write your own code but to just boost up the development and to ensure that it will be as good on all windows as it is in front of you, most of the time we use Windows APIs (Yes in Professional development too, I myself used a lot J ) and also we don’t bother about testing  these codes , Microsoft is doing it on behalf of us .  In some cases, we are restricted to use WINAPI as there is no other way to control Windows functionality. One example of this is Windows Graphics portion. There we heavily depends on WINDOWS API for its fast responses and of course there is no other way around L.
There are many other things which can be discussed here on this but we better leave this thing here itself.
Okie, coming back to our discussion, so if you remember my doc over Windows architecture, you will be remembering that the WINAPI we call are in USER MODE SESSION CALLS and at some point to get it executed it has to transfer to KERNEL MODE where OS will handle it, do the work and return the same to USER MODE again. Now today what attack I am going to discuss, this is based on this fact only.

The WINDOWS has some great flaws in its architecture and that are:


  1.          Windows heavily relies on WIN API and for windows, anything passed as argument of WINAPI ,  window treat it as a valid argument    
  2.              Windows does very minor kinda of checking over the passed arguments of WINAPI and directly runs the request.

So this makes the plot of attack. What if we hook some of the API calls of some Executables and tamper those parameters (Change it to our desired ones) and let it pass to Windows Kernel. The answer is simple: Windows Kernel will execute it, thinking that it is performing a task on behalf of the executable you have tampered. And the BINGO!!! here is that if you are able to tamper the parameters of some executables running with higher privilege mode then J ….. (I bet smile, came on your face ;D)
But this task is not as simple as it looks, it needs a different skills what we usually call Reverse Engineering.  So ready to learn it (or get your hand dirty J ) .. Well so start:

The code which we are going to take as Case Study is:


#include "stdafx.h"

#include "windows.h"
#include "stdio.h"
#include "tchar.h"

int _tmain(int argc, _TCHAR* argv[])
{
     
      printf("Launch NOTEPAD");
      getchar();

    STARTUPINFO siStartupInfo;
    PROCESS_INFORMATION piProcessInfo;
    memset(&siStartupInfo, 0, sizeof(siStartupInfo));
    memset(&piProcessInfo, 0, sizeof(piProcessInfo));
    siStartupInfo.cb = sizeof(siStartupInfo);

      CreateProcess(_T("C://Windows//notepad.exe"),NULL,0,0,FALSE,CREATE_DEFAULT_ERROR_MODE,0,0,&siStartupInfo, &piProcessInfo);
 
  getchar();
  return 0;
     
}

To learn this attack you should have following skills:


  1.              Knowledge of debugger (Windbg) (Shortly I will write on this , but not now)
  2.               Good Assembly Knowledge  ( Hope your teacher taught you J )
  3.                WIN API  knowledge  (Can get Via Windows Platform SDKs)

The attack starts as follow:


  1.                 Target the executable you want to tamper or hack  
  2.                  First you need to know that the executable you targeted uses which Dlls and from which files, for  this simply get the Import function list of this executable ,there are many  free tools available for this:

So a quick glance will reveal this info:


You can see that this executable is importing “CreateProcessW” function from KERNEL32.dll
(WINAPI to create a process)
Now I have to target this API Call. So this starts as follow:

3)      I will launch this executable from WinDbg ( I can also attach WinDbg to already running process)


                              Fig: Attached process in WINDBG (ParameterName.exe)


4)      I will put a break point on the API call CreateProcessW()

<Don’t forget to set the symbol path for WinDbg, as this is not topic of discussion, I am leaving this for now>


5)      I will run the process and wait for the Breakpoint to get hit.


6)      After this, I will take out the call stack (remember I told you should have a good knowledge of assembly J ) of this application at the moment of breakpoint hit.


7)      I will convert the first passed parameter to the function (Kernel32!CreateProcessW) to readable String value:


BINGO …………………… J , have  you seen this …. ;D
The parameter value is “C://WINDOWS//notepad.exe”

8)      Now I  am free to change this value here J , the Windows will run this request thinking that as though the application has requested to run the program ( which in fact, I tampered and changed) and the application will get launched will same privilege as  parent process (almost in 90% chances).

But again there should be some twist, isn't it  ;D , so I am giving you a hint that how you can tamper this parameter , hmmmmmmmm.. okie use “eu” command of WinDbg to tamper this parameter , let this program run and see the magic.


If still stuck, feel free to ask J  …. But I suggest you to try it by your own , it will make you feel good.


Tuesday, November 30, 2010

Buffer Overflow Vulnerability Part II : Heap Overflow


Today I will be discussing HEAP OVERFLOW. We have already seen that how a STACK OVERFLOW can be exploited to results in a massive system attack.
NO doubt, the first thing will be: WHAT IS BASIC DIFFERENCE BETWEEN STACK AND HEAP?

I will try to be as brief as possible on this topic as our discussion is on something else.

 Let me start with explaining some details about the Process, In WINDOWS every process is executed as a thread, to be very frank, Windows does not know anything with the name PROCESS, it simply schedules and run Threads. Now you all may doubt that what if the process you coded does not create any thread and runs as a single process.
The reply is that OS will run this process as a single threaded process and the main process itself runs as one thread.


To make it somewhat clearer, run Calculator application. After running calculator, start TASK MANAGER and see the number of threads count against the “calc.exe” application.


So OS is running Calculator application as a single thread and though we may say that Calculator Process is running, for OS it has to schedule a single threaded process’s parent thread.

Apparently you may also see a list of number of threads associated with all other listed applications.

So now we come back at our left discussion that what is the difference between STACK AND HEAP

The stack is the memory set aside as scratch space for a thread of execution. When a function is called, a block is reserved on the top of the stack for local variables and some bookkeeping data. When that function returns, the block becomes unused and can be used the next time a function is called.
The heap is memory set aside for dynamic allocation. Unlike the stack, there's no enforced pattern to the allocation and deallocation of blocks from the heap; you can allocate a block at any time and free it at any time.

Each thread gets a stack, while there's typically only one heap for the application (although it isn't uncommon to have multiple heaps for different types of allocation).

For an in-depth insight, let’s have a look at this program:

int foo()
{

  char *pBuffer; //<--nothing allocated yet
  bool b = true;
  if(b)
  {
    //Create 500 bytes on the stack
    char buffer[500];

    //Create 500 bytes on the heap
    pBuffer = new char[500];

   }//<-- buffer is deallocated here, pBuffer is not
} //<--- oops there's a memory leak, I should have called
   // delete[] pBuffer;

Heaps are generally used because the number and size of objects needed by the program are not known ahead of time or an object is too large to fit into a stack allocator.


Though Heap-overflow attacks are not very common in practices but still for have knowledge of this kinda of vulnerability, have a look at this code:


#include "stdio.h"
#include "stdlib.h"
#include  "string.h"
 
#define MAX_BUFFER_SIZE 16
 
//int main(void)
int main(int argc, char **argv)
{
        // Allocate memory for two buffers
        char *buffer1 = (char *) malloc(MAX_BUFFER_SIZE);
        char *input = (char *) malloc(MAX_BUFFER_SIZE);
 
        // Fill our victim buffer with As
        memset(buffer1, 'A', MAX_BUFFER_SIZE-1);
        buffer1[MAX_BUFFER_SIZE-1]='\0';
 
        printf("Buffer before overflow: %s\n",buffer1);
 
        // Use a non-bounds checked function
        strcpy(input,argv[1]);
        printf("After overflow: %s\n",buffer1);
 
        return 0;
}


This code dynamically allocates memory for 2 buffers, one buffer is filled with “A” and the other filled with arguments passed at the command line. Now just visualize that how memory looks like at different points:

With a normal amount of input:

Address
Variable
Value
003000B0
Input
BBBBBBBBBBBBBBBBB
003000C0
 ?????
 ?????????????????
003000D0
 ?????
 ?????????????????
003000E0
 ?????
 ?????????????????
003000F0
Buffer
AAAAAAAAAAAAAAAA
00300100
 ??????
 ????????????????


And

With the overflow:

Address
Variable
Value
003000B0
Input
BBBBBBBBBBBBBBBBB
003000C0
 ??????
BBBBBBBBBBBBBBBBB
003000D0
 ??????
BBBBBBBBBBBBBBBBB
003000E0
 ??????
BBBBBBBBBBBBBBBBB
003000F0
Buffer
BBBBBBBBAAAAAAAA
00300100
 ??????
 ????????????????


If we run this program with a few Bs everything works fine.
E:\Work\overflow\heapbasic\Release>heapbasic BBBBBBBBBBBBBB
Overflow buffer before: AAAAAAAAAAAAAAA
After overflow: AAAAAAAAAAAAAAA
However, if we increase the number of Bs on the command line, we see the buffer gets overflowed.
E:\Work\overflow\heapbasic\Release>heapbasic BBBBBBBBBBBBBBBBBBBBBBBBBBBBBBBBBBB
BBBBBBBBBBBBBBBBBBBBBBBBBb
 
Overflow buffer before: AAAAAAAAAAAAAAA
After overflow: BBBBBBBBBBBBBBBBBBBBBBBBBBBBb
Remember, this has nothing to do with the stack. These areas of memory that were overflowed were in the heap (and potentially non-executable).
The main aim of this tutorial is to tell how to save heap overflow so I will concentrate more over telling ways to lowers the possibility of heap overflow rather than telling the  ways to exploit the heap overflows as exploiting heap overflows is somewhat typical and out of the scope of this tutorial.
In code always check the buffer, basically any unchecked buffer is at risk.
The easiest thing to do is always check any data areas for size! Remember, just because you use a bounds checked function doesn't mean you are in the clear. strncpy(buffer, buffer2, strlen(buffer2)) is just as bad if not worse than strcpy(buffer,buffer2). Always ensures the buffer boundaries before filling data to it.


Sunday, September 12, 2010

Buffer Overflow Vulnerability : Unleashed

Today our topic of discussion is: BUFFER OVERFLOW!!!!
Believe me, these words always used to fascinate me right from the starting of my career as I know that one of the major Hacking Road comes through here only.

So Today I will be discussing Buffer Overflow here, I will discuss what we mean by buffer, what actually BUFFER OVERFLOW stands for and what benefits I can have
(NOTE: AS AN ETHICAL HACKER) of this vulnerability.

First of all let me tell you that BUFFER OVERFLOW itself has 2 variations: one named as STACK OVERFLOW and the other named as HEAP OVERFLOW (just wait they will become as clear as crystal to you within some time).
Here I will be discussing STACK OVERFLOW, Just forget about HEAP OVERFLOW as of now.

The first important thing here is: WHAT THE HECK THIS BUFFER STANDS FOR? Well, Buffer, as we used this word in our usual life also, is a fixed capacity storage area. From coding point of view I may say that Buffer is an array of fixed length.

So if I write:

char buffer[100];

Here variable “buffer” has a storage area and with the maximum length of 100 bytes.

Now let’s dive into system’s internals, you know, the best part of this vulnerability is that this is platform independent because the vulnerability does not lie in OS Platform but it lies in Microprocessor Architecture and the way they store data while executing commands.

So as long as the OS version and the vulnerable program version (Where we found some BUFFER OVERFLOW issue) will remain same, this backdoor will work.


IMP: I will be clearing very soon that why OS version is so important, as of now just proceed.


IMP: This attack will be discussed over INTEL X86 ARCHITECTURE and STACK/OPREATIONS stands for STACK/OPERATIONS of X86 PROCESSOR

Now let’s see that how the Processor provides a way to store this storage/buffer.
In Processor we have something called STACK (don’t worry as of now; it will become clear to you soon). This STACK only holds all the data which we save inside the Buffer or Storage.

In the above code:

char buffer[100];

Internally Processor will provide 100 bytes space inside the storage area STACK to hold all these data.

Now let’s focus on STACK(as we all read, it is a LIFO data structure which means that the last ingoing item inside stack will be the first out coming one and the 2 operations STACK supports are : PUSH (to Insert data) and POP (to take out data) )

In pictorial form the operations are:


                 PUSH Operation (DATA INSERTION)


                    POP Operation (DATA RETRIEVAL)

Now lets have a look that how this STACK is being implemented in X86 PROCESSOR family:
The first very important thing to notice is that in X86 families, STACK always grows downwards (from higher memory area to Lower memory area). The second important thing is that there are two registers (or variables) that are used to keep track of the stack. These are ESP and EBP (or SP and BP). They stand for Stack Pointer and Base Pointer respectively.
Now let’s discuss these registers:
ESP: This register points to the top of the stack. The ESP can be changed in a number of ways both directly and indirectly.
When something is PUSHed onto the stack, the stack increases accordingly by modifying ESP. When something is POPed off of the stack, the stack shrinks by modifying ESP. The PUSH and POP operations modify the ESP indirectly.
You may also be able to manipulate the ESP directly, like
SUB esp, 04h
This makes the stack larger by four bytes or one word. (Remember I told that the top of the stack is at a lower memory address than the bottom. The stack increase (grows/pushes out) by adding to the top of the stack. This means going to a lower memory address.)
So you may visualise this growth of stack as


You can see that the STACK is growing towards the lower area of memory


EBP: This holds the then memory address of the bottom of the stack - more accurately it points to a base point in the stack that we can use a reference point within our function. Let’s visualize this concept with these images


Let’s start with some data in the stack:


Now we have initiated some operation due to which some data has to be pushed into the stack, in this scenario the EBP will be moved from old stack’s bottom (0x99999999) to the relative new stack bottom (0x55555551)


And the value at 0x55555551 will be: 0x99999999(Old bottom of the stack).
So suppose our stack grows due to PUSH and now its like:


Remember that the value at location 0x55555551 is 0x99999999 and the value of EBP is: 0x55555551 so in this manner we have a track of the current bottom (0x55555551) and the relative bottom (0x99999999) of the stack.
Now, when we run the POP operation, this will fetch out all the data and simply reverts ESP by copying EBP into ESP.


Now ESP has value 0x55555551 and EBP has value
VAL [0x55555551] = 0x99999999.
So after this operation the values would be:


This makes the stack look exactly like before, except with some junk in lower memory addresses (which are ignored since the computer thinks the top of the stack is at 0x555555).


Apart from this, there is one more register of our interest that is EIP.

EIP: This stands for Instruction Pointer, whenever we call a function this pointer is saved on the stack for later usage. When the function returns, this saved address is used to determine the location of next executed instruction.

So now let’s start our main discussion that why this STACK is so important to us, the reason is its implementation in X86 FAMILY.

After every function calls the stack looks like:


Using assembly knowledge to change it to generic layout. It would be like:


(Small Fix: the first local variable would be EBP – 0X00000008 and not EBP-0X00000004)


And here comes the real power for us. We all know now that if the code is calling a function exactly how this function is going to get loaded in the memory for X86 FAMILY PROCESSOR (I bet you all should be enjoying by now).

So let’s have a quick look at my simple demo code:

IMP: WRITTEN IN VC++, VISUAL STUDIO 2008, run this in DENUG MODE

void test(int i , int j ,int k)
{

int buffer = 9;
printf("%d == %d ==%d",i,j,k);


}

void main()
{
test(10,20,30);
}

I have put a break point at line:

printf("%d == %d ==%d",i,j,k);

And at that time when I dumped the memory I got this valuable information:
The registry editor reveals this info for me:


EAX = CCCCCCCC EBX = 7FFD8000 ECX = 00000000 EDX = 00000001 ESI = 00000000
EDI = 0026F710 EIP = 008B13D5 ESP = 0026F638 EBP = 0026F710 EFL = 00000216

Now time to see the magic!!!!!

I have passed the parameters as:
10 (HEX: 0a), 20(HEX: 14), 30(HEX: 1e)

As per above discussion if I add 0x00000008 to EBP, I should be getting address of 1st function argument (10).
So let’s try it with same code, when I executed the command EBP+8 to see the memory of this location, I was redirected to:


We can see the value at memory location 0x0026F718 is 0a (10) bingo!!!!!
Now let’s try to find out other parameter!!!!

When I executed the command:

0X0026F710 + 0x000000C [Address (EBP) + 12(HEX)]
OR
0x0026F718 + 0x00000008 [Address(First Parameter) + 8 (HEX)]

I was able to see the next parameter value which is 14 (20 in Decimal). I also gave a local variable inside the function. So just try to find out that local variable value using EBP.
When I executed the command:
EBP – 0X00000008, I was successfully redirected to the location of first local variable (09).


So now you have pretty much got a clear idea how to navigate and access all the passed parameters values and local variables values using registers and standard System STACK.

But the attack has not started yet. Isn’t it? The basic of STACK OVERFLOW attack lies under the fact that if anyhow I will be able to write and modify the EIP (Instruction pointer) of the current stack, I will be successfully redirect code execution to some arbitrary memory area or in more sophisticated attack to my memory area where my exploit code will be waiting for its turn (I hope by this time STACK OVERFLOW ATTACK WOULD BE CLEAR TO ALL OF YOU)
Now the question is in how many ways I can do it. Pretty simple in 2 ways: Either I will keep writing in Local variables exceeds its limit, modify old EBP value and then finally modify EIP value. The second way is to keep writing to the input parameters of the function, exceeds the limit and directly rewrite the EIP. On professional and outside attacks generally the approach of exceeding the limit of input parameters is applied.

In my first example I will be showing how I will be tampering some memory location by exceeding the limit of Local variable, and then will proceed to sophisticated attack.
I wrote a very simple code as:

void crash_code()
{
char buffer[10];
scanf("%s",buffer);
//This will feed data into local variable “buffer” , try
// to exceeds the limit

}

Now whenever I will be giving some input less than or equal to 10 bytes, this code will work perfectly but giving something more than 10 bytes this will try to access invalid memory location and finally the code will crash.


But so what???? How this is beneficial for me!!!!
The answer lies via a well crafted STACK OVERFLOW attack.

To Be Continued …...  


After a long time I got a chance to complete this document, so we directly jump to our point.

Today I will be writing a code to demonstrate buffer exploit.
I wrote a very simple code to demonstrate this exploit.

#include "iostream"
#include "string"

void exploit()
{
      printf("BO Attack is successfull");
}


int main(int argc, char* argv[])
{

      printf(" The address of function to execute is: 0x%08x\n", exploit);
      char buff[2];
      scanf("%s",buff);
      return 0;
}

When execute with any char array with length up to 2 bytes this code will work perfectly.
Just have a look at the normal program execution:


My main motto is to crash this program using BO and execute the function “void exploit()” by overwriting program’s current IP with the function memory address which is: 0X00401000.

Now I will try to overflow this buffer and insert the exploit code address to run the function via buffer overflow.

When I run this program with an input more than 2 bytes it will crash.


In the crash information the “Exception Offset” is the location what I have to overwrite in order to execute my function. In simple words I have to overwrite this offset location with the function “exploit” address i.e.:  0x00401000


After some time of hit and trail method I found the exact length of string which can be used to overwrite this location.


You can see that the offset is now overwritten with 41414141 which are AAAA. Now the simple thing I have to do is that replace the last 4 A’s in my input (because these last 4 A’s only overwrote the offset) with the address of the exploit code
i.e.:  0x00401000. The program input for this would be:

“AAAAA………………..AAAA\0x00\x10\x40” (Remember the little Indian and big Indian formatJ).

And when I ran this codeJ

Appending address to the input string is very simple and you can use
char[] function_address = “\x00\x10\x40”;
strcat(inputstring, function_address) to append address at the end of the string.

(I am not discussing this here , because there should be some effort from your side also J isn’t it…More ever if you are able to do this then welcome to the world of Buffer Overflow exploit finding else need to learn “C” again)
The only one thing keep in mind the diff. b/w little Indian and big Indian architecture and the address should be “\x00\x10\x40”

So when I run this program with this crafted string


With this information we have come to the end of our discussion on Stack Overflow attack (One type of Buffer overflow).
Will be discussing Heap Overflow soon with you guys.
Comments and suggestions are welcome.